Continuous Benchmarks on a Budget
Using GitHub Actions, GitHub Pages and Blazor to run and visualise continuous benchmarks with BenchmarkDotNet with zero hosting costs.

Over the last few months I've been doing a bunch of testing with the new OpenAPI support in .NET 9. As part of that testing, I wanted to take a look at how the performance of the new libraries compared to the existing open source libraries for OpenAPI support in .NET, the most popular including NSwag and Swashbuckle.AspNetCore.
It's fairly easy to get up and running writing some benchmarks using BenchmarkDotNet, but it's often a task that you need to sit down and do manually when you have the need, and then gets forgotten about as time goes on. Because of that, I thought it would be a fun mini-project to set up some automation to run the benchmarks on a continuous basis so that I could monitor the performance of my open source projects easily going forwards.
In this post I'll cover how I went about setting up a continuous benchmarking pipeline using GitHub Actions, GitHub Pages and Blazor to run and visualise the results of the benchmarks on a "good enough" basis without needing to spend any money* on infrastructure.
*Unless you want to use this with GitHub Enterprise Server or non-public repositories. More information about this later.
The Ideal
In an ideal world, we'd all have access to a dedicated performance lab, with a number of dedicated high-specification physical machines that we could use to run benchmarks on a regular basis. We could generate reams of data from these benchmarks, and then ingest that data into a data warehousing solution and run reports, generate dashboards and much more to monitor performance metrics for the software we're building.
The .NET team is an engineering team with the budget for such a setup, and they have engineers dedicated to performance testing and the supporting infrastructure needed to run them. For example they have a dashboard using Power BI that they use to track the performance of the ASP.NET Core framework over time using dozens of benchmarks for ASP.NET Core and the .NET Runtime that the product engineers can use to test the impact of changes they make, and are run on a regular basis to identify regressions. You can read more about their benchmarks in GitHub.
As great as that would be, we're not all the likes of Microsoft, especially in the open source world. I don't know about you, but I certainly don't have the budget to maintain a dedicated performance lab, physical or virtual, and a data warehouse to run on top of it. How can we as open source software developers leverage the free tools available to us today to achieve something similar in spirit to an Enterprise-level solution that still gives us value?
Prior Art and Inspiration
I'm a big fan of GitHub Actions, and use it for all of my own software projects to build and deploy my software, as well to automate other tasks like applying monthly .NET SDK updates or housekeeping tasks like clearing out old Azure Container Registry images. GitHub Actions also comes with a generous free tier for public repositories - at the time of writing you get unlimited minutes for running GitHub Actions workflows, capped at 20 concurrent jobs for Linux and Windows runners (macOS is less generous, at 5).
GitHub Actions isn't ever going to be a like-for-like replacement for dedicated performance machines, especially on the free tier rather than with custom dedicated runners, but it's a great alternative. We can't rely on these runners to give us accurate absolute benchmark results (i.e. how fast can my code possibly ever go), but we can use them to give us good relative benchmark results to produce trends over time. There will still be an element of noise in the results due to the shared nature of the runners because we have no control over the underlying hardware they run on, so they may change unexpectedly over time as the service is upgraded, but that's a trade-off that can be balanced against the usefulness of such an architecture for a "budget performance lab".
Given that, my first thought was that someone must have already written a GitHub Action to run benchmarks and collect the data for them. Indeed, that was the case and the action I found that ended up being a major source of inspiration for my own setup was the benchmark-action/github-action-benchmark action.
The action supports 10 existing performance testing tools, including BenchmarkDotNet for .NET, other tools for Go, Java and Python, as well as custom tools. The action ingests the output of these tools, summarises the results into a JSON document, and then pushes the results into a GitHub repository. It also commits static assets like HTML, CSS and JavaScript files to the repository alongside the results so that you can view the results in a web browser. The static pages include charts generated using Chart.js so that you can view trends in the data over time and spot regressions. The action can also be configured to comment on pull requests or commits if it determines that a regression has occurred in the benchmark data, removing some of the burden of needing to watch for changes by eye.
By setting up a GitHub Pages site to serve a website for the content of the repository, you can use the static HTML files to visualise the results of the benchmarks in a browser. GitHub Pages is free to use, so using a public GitHub repository (free) to store the data in conjunction with GitHub Pages to view the results (free) and GitHub Actions to run BenchmarkDotNet to generate the results (free), you can see how we've got all the pieces in place to host a continuous benchmarking solution without needing a budget for any hardware, infrastructure or hosting.
The Solution
OK, so if there's already an action do to all of this, why did I go and write my own version of it? While the existing action is great, because it's focused on multiple different tools, there's an element of least common denominator to the features it has. The key feature that it lacked for BenchmarkDotNet was the ability to visualise memory allocations in the charts in addition to the time/duration for the benchmarks. There were also a number of minor other things I wanted to be able to do that the existing action didn't support out-of-the-box, like customing Git commit details.
While the UI it provides by default is functional, and it's possible to create your own custom UI to visualise the data, the JavaScript to generate the dashboards hasn't really been designed with testability and extensibility in mind (in my opinion). As I started to customise the provided code over a week or so to meet my needs, I found I was often breaking it with unintentional regressions, and it was difficult to test in the form it's provided in by default.
With that in mind, I decided I would create my own fork-in-spirit of the original action, but with a focus on BenchmarkDotNet. This would allow me to customise the UI to my needs, and to make it more testable and extensible in the future. Also, a new side-project is always a fun excuse to learn some new technology!
Storing the Data
The first part of the solution, the data storage, is the easiest part. For this, all I needed to do was create a new public GitHub repository (martincostello/benchmarks, how imaginative). For the design, the repository uses its branches to represent branches in the source repository, with the data for each specific repository stored in a directory named after the repository. The data is then stored in JSON files checked into the repository, providing a history of the benchmark data over time that can be tracked using standard Git tools.
Using a dedicated repository for the data has a number of benefits:
- All the data is stored in one repository, making it easy to access and query (and potentially migrate in the future if I need to change the data format);
- The benchmark results do not affect the Git history of the source repository;
- The dashboard can be deployed and versioned independently of the data - otherwise there'd be a lot of churn in the repository as the data is pushed.
The main trade-off here, compared to storing data in the source repository, is that each repository generating benchmark results needs to have a GitHub access token configured that has write access to the data repository. This is just a minor inconvenience in terms of needing to add it to the neccessary repositories, rather than security concern. There's nothing stored in the data repository other than the data and GitHub files (README etc.).
Generating the Benchmarks
For the second part of the solution, I created a new custom GitHub Action based on the existing action: martincostello/benchmarkdotnet-results-publisher
The action is written in TypeScript, so it runs as a native JavaScript action in GitHub Actions workflows, rather than needing any additional software to be installed on a GitHub Actions runner.
Some of the improvements I made for my version of the action include:
- Add data points for memory allocations when present to the Benchmark.NET results' JSON;
- Support for customising the Git commit message and author details;
- Pushing the data to the repository using the GitHub API to avoid the need to clone the data repository;
- Pushing the data as valid JSON, rather than as a JavaScript object literal assigned to a
windowglobal variable.
With the action published, the next step is to use it to generate the benchmark results from the source repositories.
I won't get into the specifics of writing the actual benchmarks using BenchmarkDotNet, but the key part is a GitHub Actions workflow (example) that runs the benchmarks using a GitHub-hosted Linux runner. At the time of writing, these use Ubuntu 22.04 using x64 processors and have 1 CPU with 4 logical cores. The workflow then uses the action once the benchmarks have been run to publish the results to the benchmarks repository. The workflow runs for all pushes to a number of branches in the repository, as well as being able to be run on-demand if needed.
I've chosen not to run the benchmarks on every pull request for a few reasons:
- Pull requests from forks and from Dependabot do not have access to secrets - this means the data cannot be pushed to the other repository;
- I don't want to tie-up a lot of my GitHub Actions capacity running the benchmarks for all PRs given that most pull requests are unlikely to change the performance characteristics of the code;
- If a regression is detected post-merge (like this), I can easily investigate the cause after-the-fact and either fix-forward or revert the change.
The only requirement over basic BenchmarkDotNet usage is that the benchmarks need to be run with the --exporters json option to generate the benchmark results in JSON format. This is for the action to use to generate the summarised data for the dashboard.
Visualising the Data
The final piece of the puzzle is the dashboard to visualise the data. I've been looking for a good excuse to try writing something using Blazor for a while, but I've never had a good reason to do so that would have otherwise needed a re-architecture of an existing web application of mine. This seemed like a great opportunity to give it a try and learn something new.
As the dashboard is hosted in a GitHub Pages site, there's no back-end to the application, so a Blazor WebAssembly (WASM) application is the only avenue open to developing a Blazor application in this context.
I wouldn't consider myself a web developer (centering divs is always hard, somehow), but I found Blazor to basically be "React with C#", so given my comfort with C# and .NET development it was relatively easy to pick up once I got my head around a few new concepts (the render cycle, etc.). The difference between the original HTML with embedded JavaScript and my new Blazor version is night and day.
I was also able to use .NET Aspire as a good source of inspiration and practices for writing Blazor applications as the Aspire Dashboard is itself a Blazor application (albeit not Blazor WASM). It was also the source of inspiration I used for moving from Chart.js to Plotly for the charts in the dashboard so that I could add error bars to the data points from the benchmarks.
It was also an opportunity to look into bUnit for testing the dashboard. I won't go on a tangent about bUnit, other than to say I was really impressed with how it plugged into the existing .NET test ecosystem I'm familiar with using xunit. It was really easy for me to add unit tests for the components and pages and get good coverage of the codebase (80%+) with existing tools like coverlet and ReportGenerator to publish to codecov.io.
I was able to signficantly extend the original kernel of the dashboard idea from the github-action-benchmark action to include a number of additional features that I wanted to be able to use. These included:
- Viewing all data from a single HTML page, not matter the repository or branch;
- Being able to load the data using the GitHub API to support storing the data in a different repository;
- Support for GitHub Enterprise Server or internal/private repositories (we can build and deploy copies of the dashboard onto my employer's GitHub Enterprise Server instance for teams to use internally);
- GitHub authentication using device flow to increase the rate limits for the GitHub API and support the above;
- Deep-linking to specific repositories/branches/charts;
- Downloading the charts as images for use elsewhere (like in blog posts or GitHub issues).
You can find the source code for the dashboard in the martincostello/benchmarks-dashboard repository. If you'd like to host your own version, you can either fork it and modify it to your needs and deploy from there, or you could use the repository via a Git submodule in your own repository to host the dashboard in a subdirectory of your repository and then customise the build process and change the configuration etc. before you deploy it. The submodule approach is what I've used to deploy an orange-themed version of the dashboard for use in GitHub Enterprise Server at my employer for some internal repositories.
The No-Cost Exception
The device flow support is the one exception to the "no cost" rule for the solution. As a client-side application with no back-end, the normal GitHub OAuth flow cannot be used to authenticate a user to obtain an access token for the GitHub API as it would expose the client secret to the browser. The device flow is a way to authenticate the user without needing a secret, but it does not support CORS, so it's not possible to use it directly from a browser. To work around this, I added an endpoint to an existing API of mine to proxy the device flow requests to GitHub with CORS support and then return the access token to the client.
This doesn't cost me anything extra as I already had a running piece of unrelated infrastructure that I could use for this purpose. If you wanted to run this solution yourself with GitHub Enterprise Server, or private repositories, you would similarly need to deploy (or extend) some infrastructure to proxy the device flow.
Similarly, I added a custom domain to the GitHub Pages site, but this was again a cost I already had for my domain and DNS, so wasn't an additional cost. It's still possible to use the default GitHub Pages domain to host the site, you just don't get the custom/vanity URL to serve it over.
⚠️ If you need to use device flow with non-public repositories hosted in GitHub.com, you should do so over a custom domain so that you can restrict the allowed hosts for CORS to your domain, as otherwise you would need to allow it for the entire GitHub Pages domain, or otherwise restrict it somehow (e.g. by referrer or IP address).
The End Result
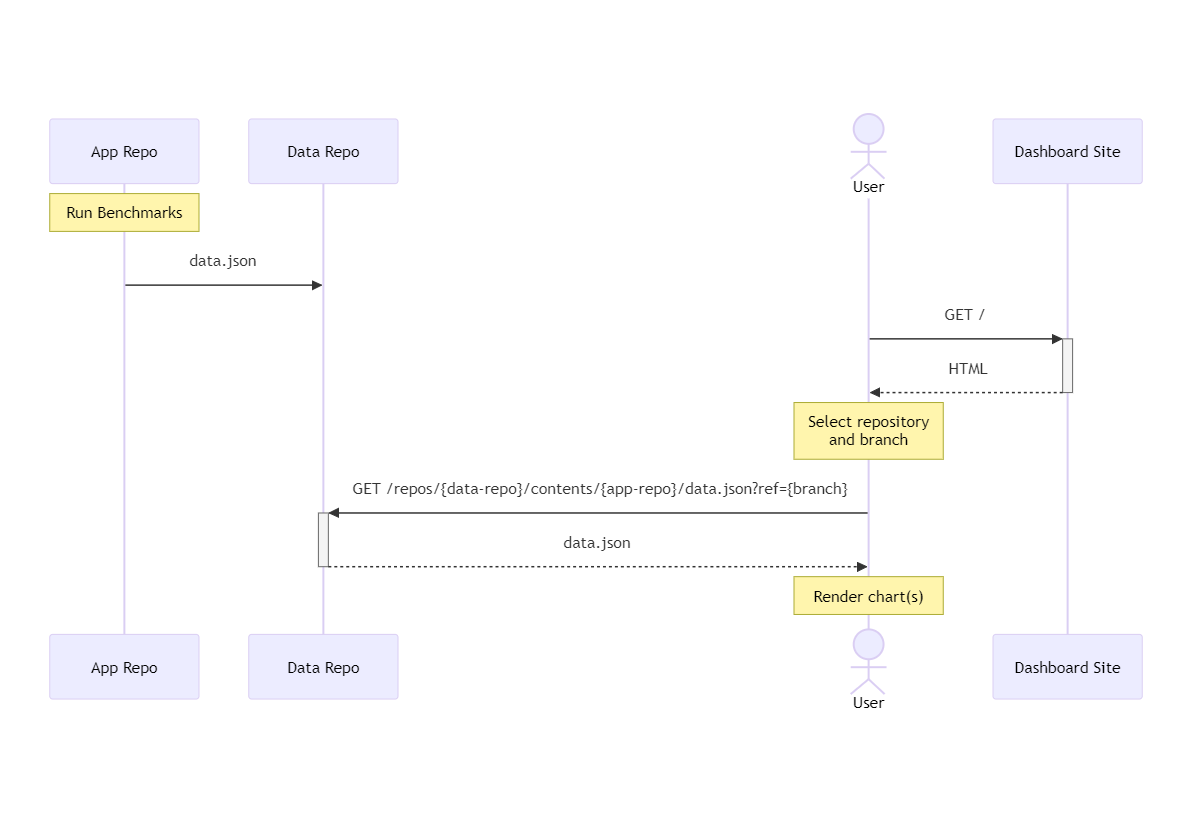
With all the pieces in place, at a high-level the solution looks something like this:

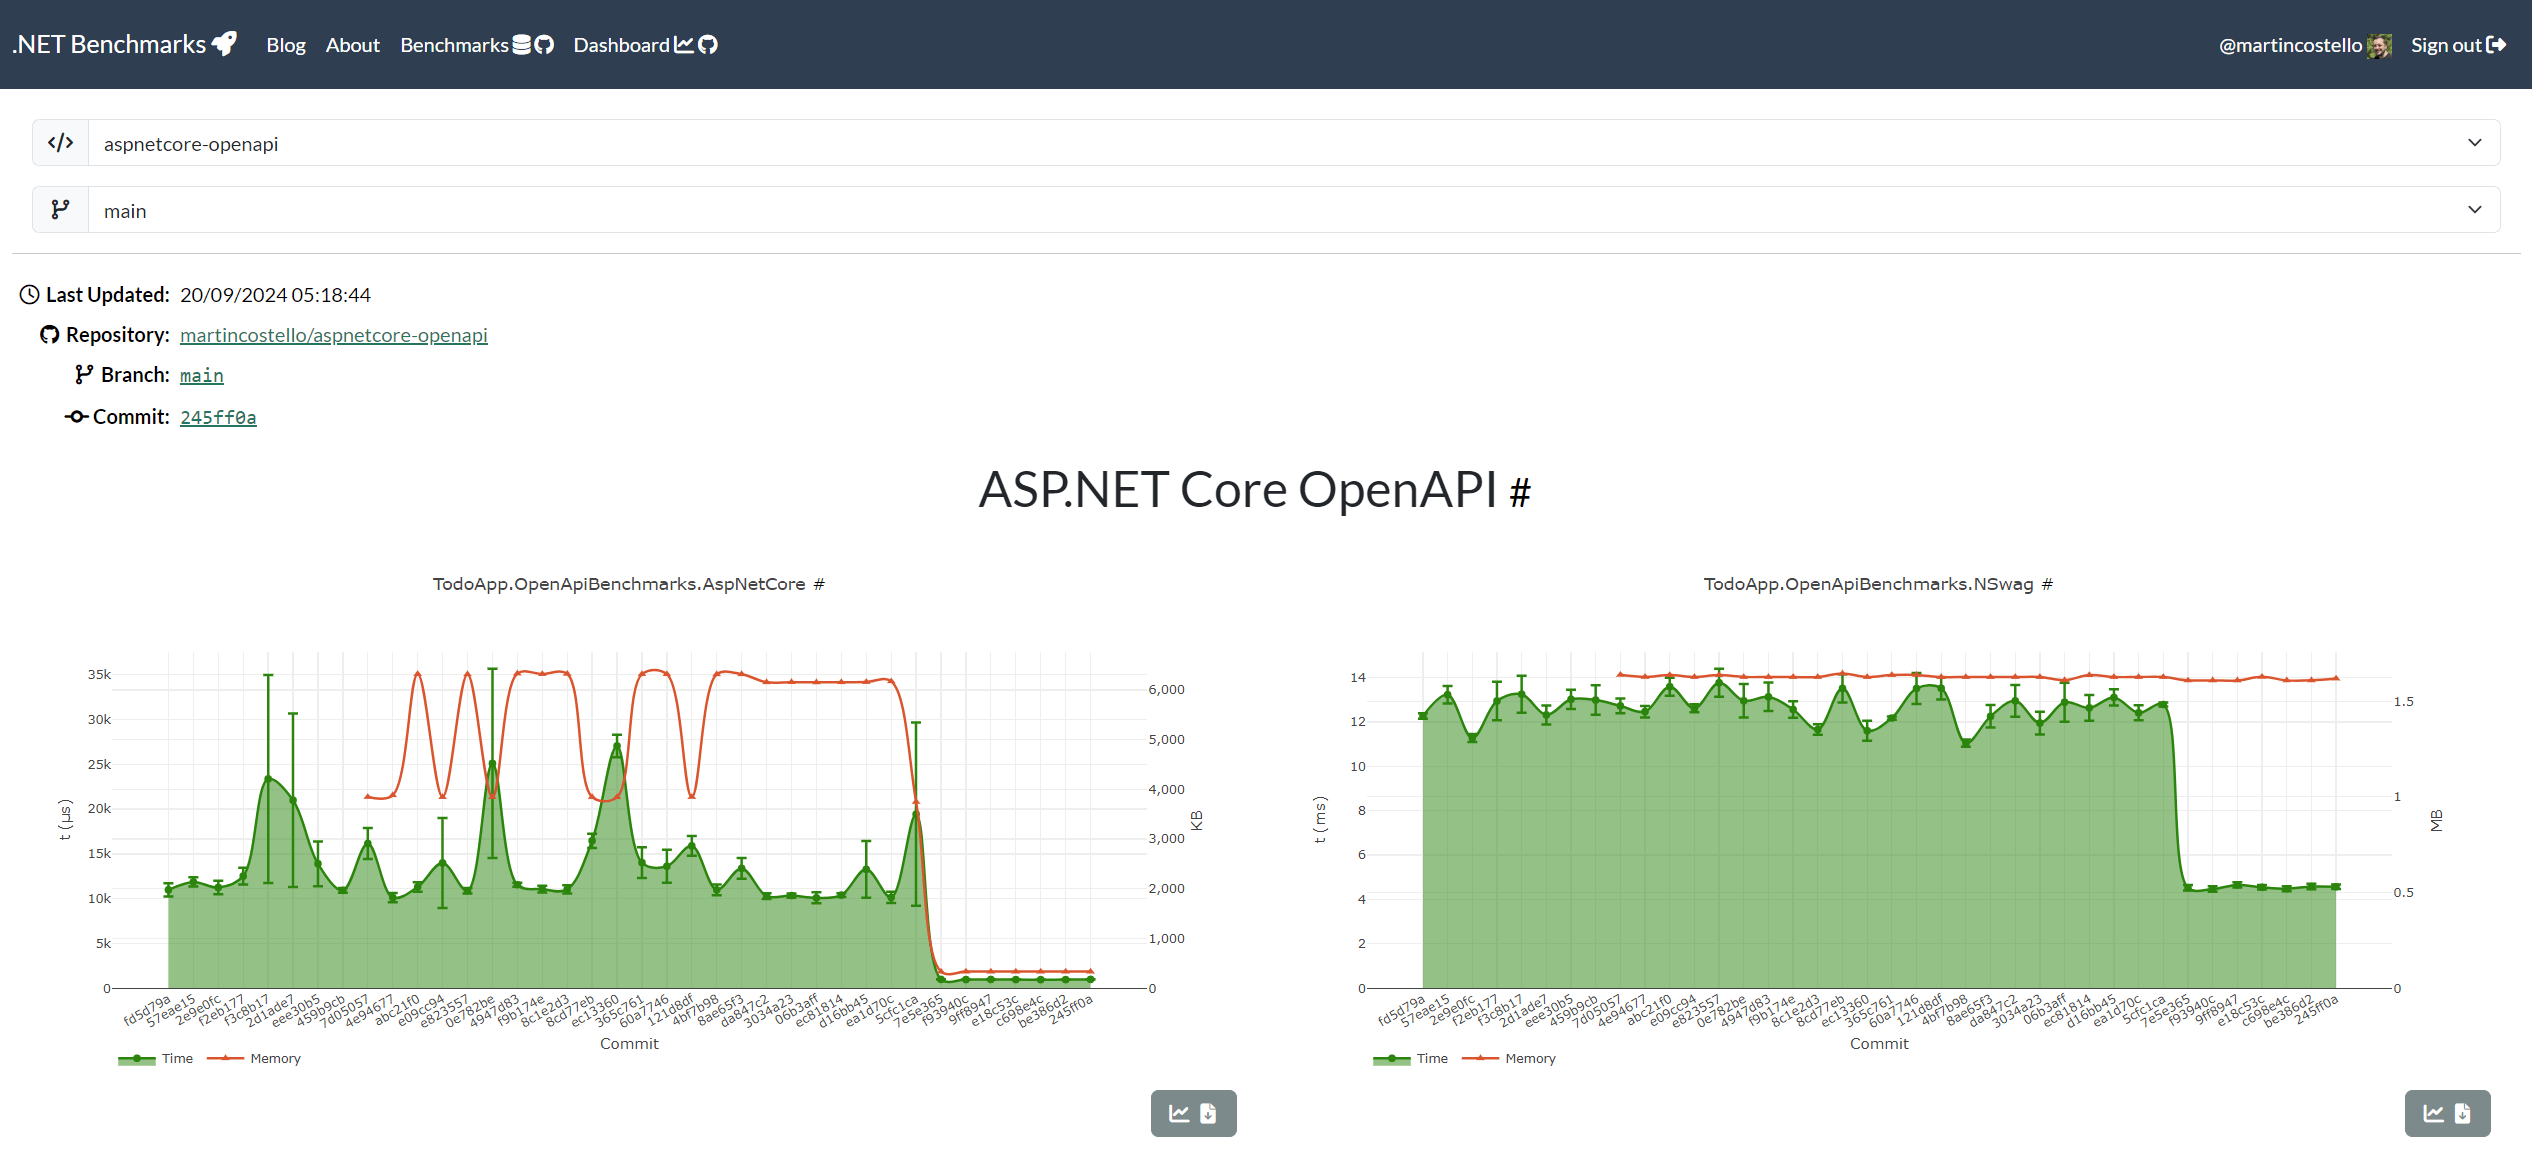
Which for the end-user (i.e. me) gives a nice interactive dashboard to visualise the results like this:

I've set up a demo repository (martincostello/benchmarks-demo) that you can use as an inspiration for setting up some Benchmark.NET benchmarks and then using a GitHub Actions workflow to run them and publish them to another repository.
Concrete Results
So with this solution in place, what have I been able to achieve with it so far?
First, the dashboard was incredibly useful to track the fixes for a number of performance improvements in the new ASP.NET Core OpenAPI library. These are covered in more detail in my previous blog post, but the dashboard was invaluable in tracking the effect of the changes on the performance of the library over time as changes were made, particularly when ASP.NET Core 9 Release Candidate 1 was released.
The second concrete outcome from using the dashboard was the discovery of a performance regression in the .NET Runtime in .NET 9.
With the release of .NET 9 RC1 on the 10th of September 2024, I updated a number of my own applications to use the new version of the runtime as RC1 is the first preview of .NET 9 with "go-live" support. After updating a number of applications and deploying them to my "production" environments, I took a look at the dashboard to review any changes in the performance of the applications.
I expected a good number of the benchmarks to show that the time taken for the benchmarks had reduced and/or used less memory. This was the case for the majority of the benchmarks, but there was one benchmark that bucked the trend and went in the wrong direction.
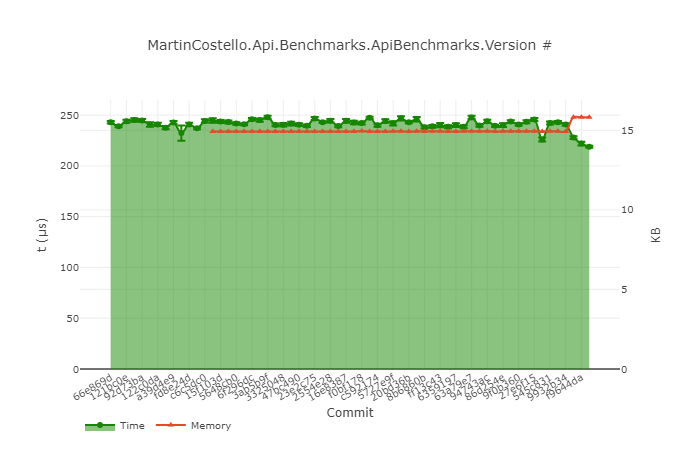
Going back to the chart shown at the top of this blog post, you can see that the red line denoting memory usage has a noticeable, and consistent, uptick a few commits ago:

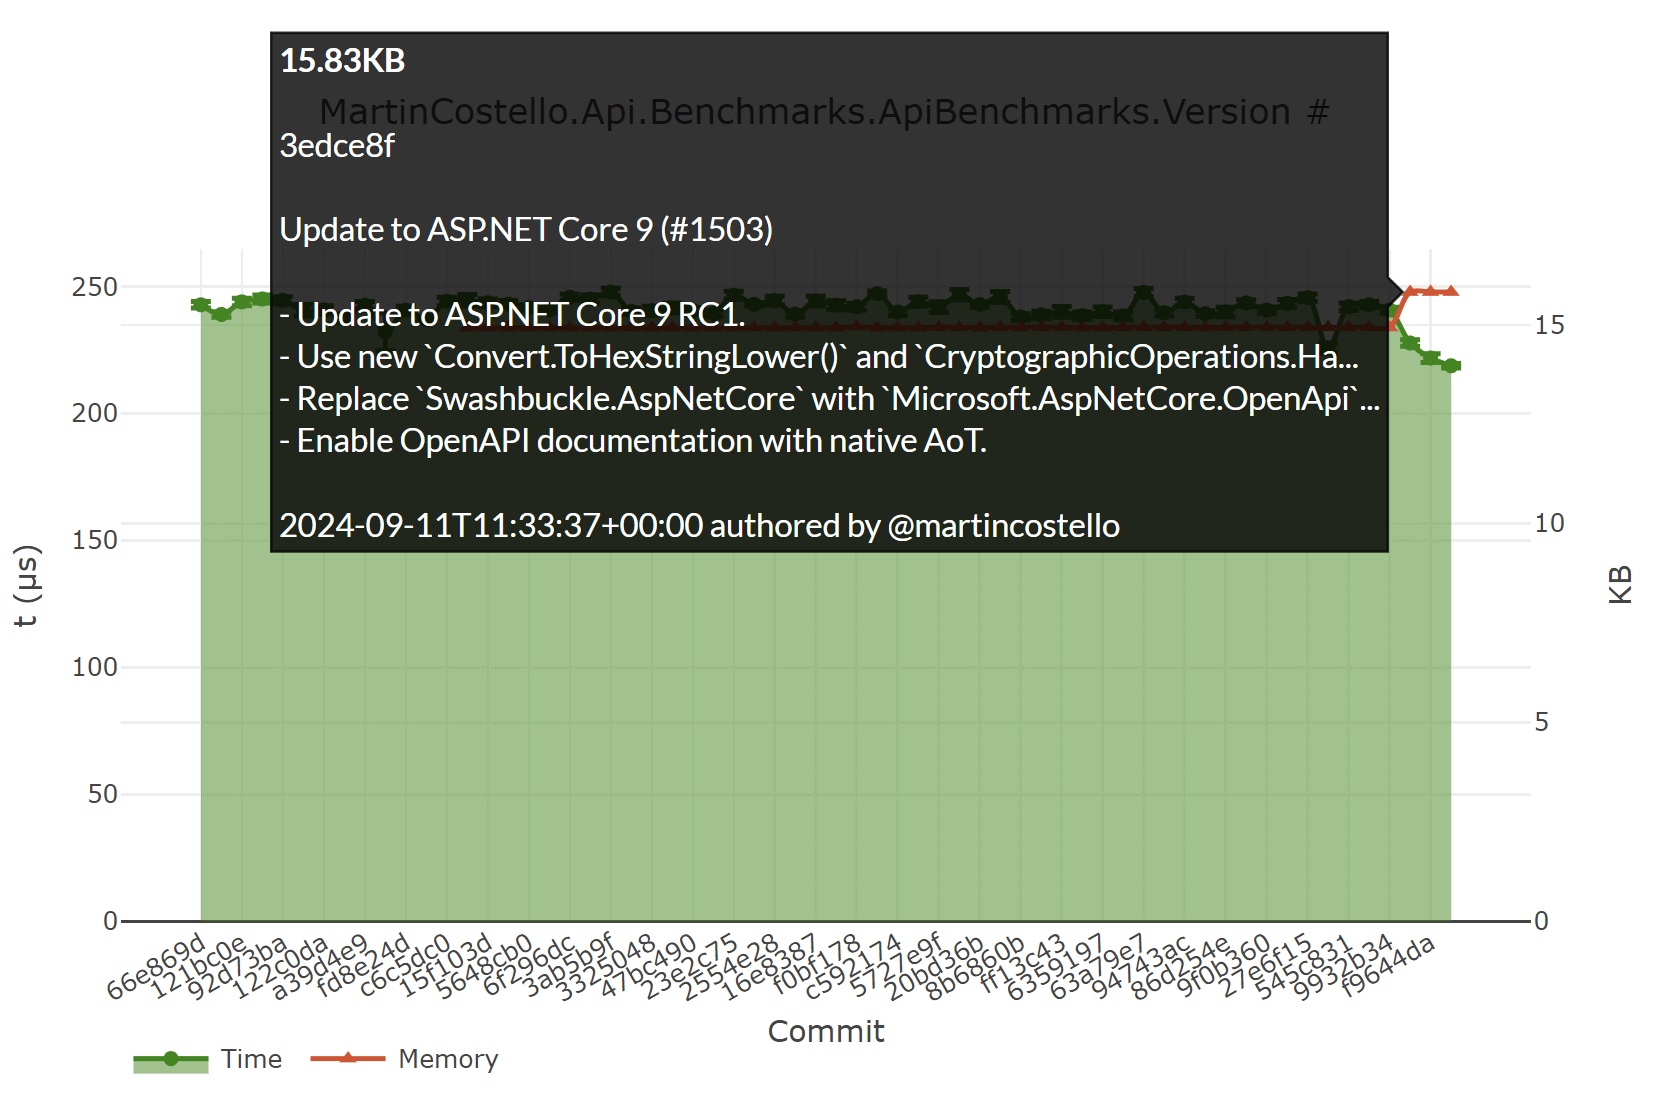
If we hover over the first data point in the uptick, we can see that the change is from the upgrade from .NET 8 to .NET 9 RC1:

I hadn't spotted this regression previously as the benchmark data is something I'd started collecting relatively recently, and the trends didn't go back far enough to show the regression at the time it was made through my testing of the .NET 9 pre-releases. It was only when I merged the upgrade to main and the data I'd started collecting in that branch for .NET 8 was the difference apparent.
The regression also escaped the regression comment functionality of the GitHub Action. The memory used compared to the previous commit was ~106% - this is lower than the default threshold of 200% (i.e. double, carried through from github-action-benchmark) to avoid noisy false positives from variance in the performance of the GitHub Actions runners. When I've been running these benchmarks for a bit longer, I might revisit this threshold to see if it can be lowered (either by changing the config, or maybe the default itself) to avoid missing such regressions in the future. In this case, it was manual review that spotted it, rather than anything automated.
The specific benchmark calls an endpoint that as I use as the health endpoint in a number of my applications for containers deployed to Azure App Service. The endpoint uses JsonObject to return a JSON payload that contains a number of useful properties about the application, such as the Git commit it was built from, the version of .NET its running, etc. This isn't an area I would have expected to see a regression, but also isn't on a critical path, so wouldn't have been particularly noticeable in usage of the applications themselves. It also turned out not to be an anomaly, as the same endpoint is present in several of my applications copy-pasted, and each one showed the same regression.
I figured it would be worth raising the issue with the .NET team, so I created a more pared-down version of the benchmark. The original benchmark is an "end-to-end" benchmark that calls the endpoint over HTTP, so I extracted the body of the endpoint into a separate method and then benchmarked it in isolation. By itself, the same code showed the same regression, but without being compensated for by improvements elsewhere in the .NET 9 runtime and ASP.NET Core 9, the regression was relatively significant. Compared to .NET 8, the memory usage had increased by 70% and the time taken to run the benchmark had increased by 90%. Ouch.
I raised the issue with the .NET team, and they were able to identify the cause of the regression as part of adding suport for explicit ordering of the properties of JsonObject: dotnet/runtime#107869. The issue was fixed just three days later, and will be included in release candidate 2 of .NET 9 in October. The team also added new benchmarks to their existing suite to ensure that such a regression in this area doesn't slip by in the future.
I think both these examples of otherwise unnoticed issues demonstrate the usefulness of having a continuous benchmarking solution in place!
Summary
In this post I've covered how I set up a continuous benchmarking solution using GitHub Actions, GitHub Pages and Blazor to run and visualise the results of BenchmarkDotNet benchmarks without needing to spend any money on hardware, software or infrastructure. The solution is good enough to provide a consistent relative view of the performance of the software I maintain over time, and to spot any regressions in their performance.
I'm looking forward to see what changes, and any issues, this setup might reveal in 2025 and beyond once .NET 10 development kicks off.
If you'd like to run your own copy of this solution, or if you have suggestions about how to improve or extend it, feel free to open an issue in either the action or dashboard repositories. I'd also be curious to hear about any other issues you might find that you wouldn't have otherwise noticed if you adopt this approach for your own code projects.
I hope you've found this post interesting and its given you some inspiration to add a similar capability to your own workflows. 💡